(Guest Blogged by Hale "Bonddad" Stewart)
This is a post from my blog, with some additional commentary.
The markets had a really bad day today. The fundamental reasons are a huge writedown at GM of $39 billion, China 's plan to diversify it's currency reserves, and ongoing concern about the credit markets.
Bloomberg: General Motors Corp., the world's largest automaker, reported a record $39 billion quarterly loss after three money-losing years forced the company to write down the value of future tax benefits. The loss, excluding the tax writedown, was $2.80 a share, more than 12 times analysts' estimates. Mortgage-related losses at GM's partly owned finance unit overwhelmed auto sales that were the highest ever. GM shares fell 5 percent, giving the Detroit-based automaker a market value of $19.4 billion, about half the size of the third-quarter loss. GM signaled that it won't generate enough earnings to use the benefits. Chief Executive Officer Rick Wagoner cited concerns about defaults on subprime mortgage loans at GMAC LLC and auto sales in the U.S. and Germany . Slumping U.S. sales in the past half year ``feel like the conditions we're going to face,'' Wagoner said. ``This all suggests that GM thinks that things are so ugly out there that they can't see the possibility of profitability for many quarters, maybe even years,'' Bradley Rubin, an analyst with BNP Paribas in New York, said in an interview.
From Bloomberg: The dollar fell to a record versus the euro and the lowest since 1981 against the pound after Chinese officials signaled plans to diversify the nation's $1.43 trillion of foreign exchange reserves. The U.S. dollar also declined to the cheapest versus the Canadian dollar since the end of a fixed exchange rate in 1950 and a 23-year low against the Australian dollar. The New York Board of Trade's dollar index touched to 75.077, the lowest since the gauge started in March 1973. ``The dollar sell-off was sparked by concern that foreign central banks' diversification away from dollar assets may accelerate,'' said Paresh Upadhyaya, who helps manage $29 billion in currency assets at Putnam Investments in Boston. ``The momentum to sell the dollar still persists and I expect further dollar weakness before year end.''
The dollar has been reeling since the rate cuts, and this certainly did not help matters any.
Let's look at the charts to wee what happened.
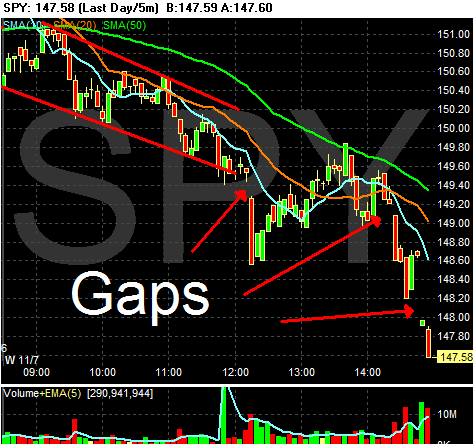
This is a very ugly daily chart. 1.) The overall direction is down -- big time down. 2.) There are three downward gaps that occurred on heavy volume. That's not good. 3.) The market closed at the low point, on heavy volume just after the third gap down. That's a triple whammy of bad events. Traders didn't want to hold positions overnight because they were concerned something would happen between now and the open that would lower stock prices.
Why are gaps down bad? To Quote Bulkowski from Encyclopedia of Chart Patterns , "...in both cases [of upward and lower gaps] some type of exuberance is driving the stock to create a gap (page 241)." In other words, there is a strong emotional reason for the change. It's safe to say that a downward gap is a sign of extreme concern. When there are three gaps on a single day, it's s sign of really extreme concern.
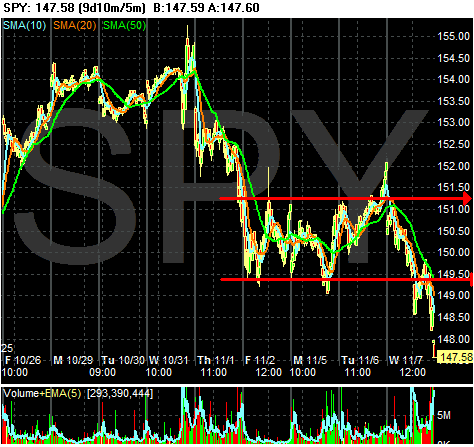
The 9-day chart shows the SPYs were in a three and a half day consolidation/trading range. But they broke through support on heavy volume at the end of trading.
Breakdowns indicate a change in sentiment. When they occur on heavy volume sentiment it's that much more intense.
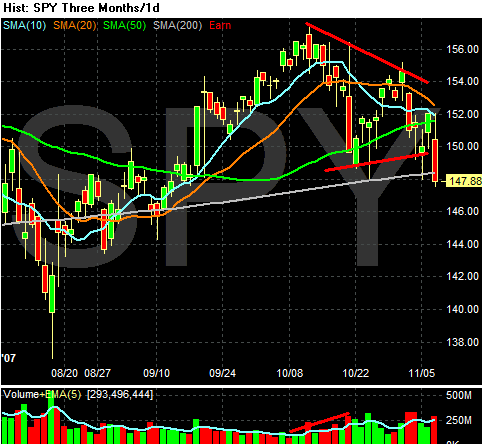
The SPYs daily chart shows we have broken through support and the 200 day SMA on heavy volume. Again a triple whammy.
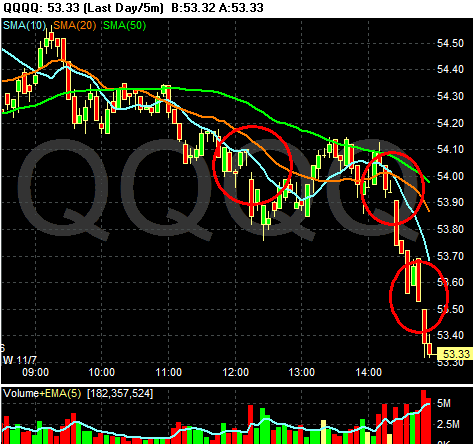
The one day QQQ chart also shows three downward gaps that occurred on heavy volume. Also notive the index sold-off at the end of trading on heavy volume.
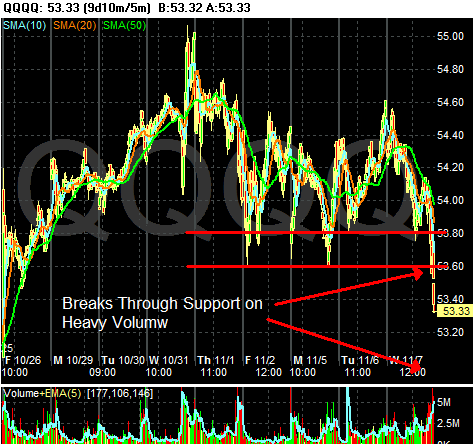
The 10-day QQQQ chart shows they too were in the middle of a consolidation pattern, but they also broke through support on heavy volume at the close of the market. This is not good.
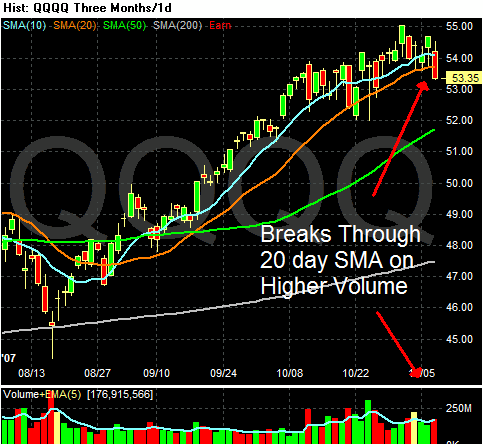
The daily QQQQ chart shows the index broke though the support of the 10 and 20 day SMA on heavy volume.
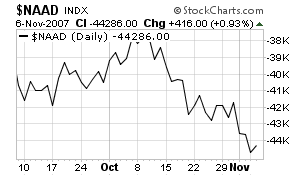
That's very bad. In addition, consider these two charts from stockcharts.com.
NASDAQ Breadth
NASDAQ new highs/new lows
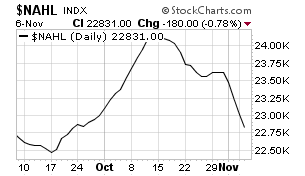
Both of these charts tell us that fewer and fewer NASDAQ stocks were responsible for the index's gains. That indicates there was a lack of breadth across a wide swath of stocks.
Short version -- this day was terrible. It did a lot of technical damage. On top of that, there was a terrible confluence of negative events that just sunk the market.